
最佳实践
弹性部署服务推理性能调优
在弹性部署服务中,推理性能的优化是确保系统高效运行和用户体验的关键。尤其在深度学习服务中,如何确保硬件资源的高效利用,如何排查瓶颈,并选择最佳的配置,成为了优化过程中的重点。本文将详细介绍一系列的调优建议,帮助用户从硬件、软件、部署环境等多个层面提升推理性能。
1. 检查 GPU 是否实际被使用
在深度学习推理任务中,GPU 的利用率至关重要。首先需要确认硬件是否被正确识别,并且能够支持 GPU 加速。
1.1 验证 GPU 可用性
要确认 GPU 硬件的可用性,可以通过以下命令检查:
nvidia-smi
lspci | grep -i nvidia

nvidia-smi --query-gpu=driver_version --format=csv
nvidia-smi 命令会列出当前 GPU 的详细信息,如内存、驱动版本、GPU 利用率等。lspci 命令帮助确认 NVIDIA 硬件是否被系统识别。
1.2 在代码中验证 GPU 使用
通过深度学习框架(如 PyTorch 和 TensorFlow)验证代码是否正确使用 GPU:
import torch
import tensorflow as tf

print(f"PyTorch 版本:{torch.__version__}")
print(f"CUDA 可用:{torch.cuda.is_available()}")
print(f"GPU 数量:{torch.cuda.device_count()}")
if torch.cuda.is_available():
    print(f"当前 GPU: {torch.cuda.get_device_name(0)}")
    print(f"GPU 内存:{torch.cuda.get_device_properties(0).total_memory / 1024**3:.2f} GB")

print(f"TensorFlow 版本:{tf.__version__}")
print(f"GPU 设备列表:{tf.config.list_physical_devices('GPU')}")
上述代码会检查是否有 GPU 可用,并显示 GPU 的型号和内存。
1.3 运行时 GPU 使用监控
要实时监控 GPU 的使用情况,可以使用以下工具:
nvidia-smi -l 1

nvidia-smi pmon -i 0

pip install gpustat
gpustat -i 1
nvidia-smi -l 1 命令会以 1 秒的间隔持续显示 GPU 的实时状态,而 gpustat 提供了更易于理解的 GPU 状态输出。
2. 尝试更换高性能 GPU,确认性能瓶颈是否与 GPU 硬件相关
在进行推理优化时,如果 GPU 利用率低或性能不理想,可能是硬件的性能瓶颈。为了验证这一点,可以通过以下基准测试来评估不同 GPU 的性能。
2.1 GPU 性能对比测试
使用矩阵乘法来测试 GPU 的计算性能:
import torch
import time
import numpy as np

def gpu_benchmark():
    device = torch.device("cuda" if torch.cuda.is_available() else "cpu")

    # 测试矩阵乘法性能
    sizes = [1000, 2000, 4000, 8000]
    for size in sizes:
        a = torch.randn(size, size).to(device)
        b = torch.randn(size, size).to(device)

        # 预热
        for _ in range(10):
            torch.matmul(a, b)

        # 性能测试
        start_time = time.time()
        for _ in range(100):
            torch.matmul(a, b)
        torch.cuda.synchronize()
        end_time = time.time()

        print(f"矩阵大小 {size}x{size}: {(end_time - start_time) * 1000:.2f}ms")

gpu_benchmark()
通过测试不同矩阵大小的乘法,可以大致了解 GPU 的计算能力,并帮助确认是否需要更换更高性能的 GPU。
3. 尝试根据显卡驱动版本更换 CUDA、cuDNN 和 PyTorch 等版本
不同的 GPU 驱动版本和框架版本可能会对性能产生较大影响。为了确保系统能够充分利用硬件资源,需要保证 CUDA、cuDNN 与 PyTorch 版本的兼容性。
3.1 版本兼容性检查
使用以下命令检查当前驱动和框架版本:
nvidia-smi
nvcc --version
python -c "import torch; print(torch.__version__); print(torch.version.cuda)"

python -c "import torch; print(torch.backends.cudnn.version())"
官方的版本兼容性矩阵可以帮助我们确定各个版本的兼容性,避免不兼容导致的性能问题。
- PyTorch 版本兼容性
- CUDA 兼容性文档
- CUDA Toolkit 12.9 Update 1 - Release Notes — Release Notes 12.9 documentation
- Supported Products — NVIDIA cuDNN Frontend
4. 尝试更换基础镜像,手动部署
容器化部署可以极大简化环境管理和服务的扩展性。根据不同的需求,选择合适的基础镜像非常重要。不同的镜像会影响运行时的性能,以下是几种常见的选择策略。
4.1 基础镜像选择策略
4.1.1 官方 PyTorch 镜像
FROM pytorch/pytorch:2.7.0-cuda12.6-cudnn9-devel这个镜像包含了官方提供的 PyTorch 框架,并预装了 CUDA 和 cuDNN 加速库,适合大多数深度学习应用。
4.1.2 NVIDIA 官方 CUDA 镜像
FROM nvidia/cuda:12.6.3-cudnn-devel-ubuntu22.04此镜像提供了 NVIDIA 官方优化的 CUDA 运行时环境,更适合需要高度自定义配置的用户。
4.1.3 轻量级 Ubuntu 镜像
FROM ubuntu:20.04适合需要手动安装依赖并高度定制环境的场景。
相关镜像连接:
- ubuntu - Official Image | Docker Hub
- nvidia/cuda - Docker Image | Docker Hub
- pytorch/pytorch - Docker Image | Docker Hub
- tensorflow/tensorflow - Docker Image | Docker Hub
4.2 多阶段构建优化
为了减少镜像的大小,可以使用多阶段构建来优化镜像内容:
FROM python:3.9-slim as builder
WORKDIR /app
COPY requirements.txt .
RUN pip install --no-cache-dir -r requirements.txt

FROM nvidia/cuda:11.8-runtime-ubuntu20.04
WORKDIR /app
COPY --from=builder /usr/local/lib/python3.9/site-packages /usr/local/lib/python3.9/site-packages
COPY . .
CMD ["python", "inference_server.py"]
通过分阶段构建,可以确保运行环境只包含必要的文件,从而减少镜像的体积。
5. 使用 vmstat、glances 和 nvidia-smi 等工具监控系统资源
监控工具能够帮助你实时获取系统和 GPU 的资源使用情况,帮助快速发现性能瓶颈。
5.1 系统监控工具使用
以下工具可以帮助你获取 CPU、内存、磁盘 I/O、网络等多方面的资源使用情况:
apt-get install -y htop glances atop iotop nethogs sysstat

glances

vmstat 1
htop

iotop -o
iostat -x 1

nethogs
netstat -tulnp

sar -u 1 10  # CPU使用率
sar -r 1 10  # 内存使用率
sar -d 1 10  # 磁盘I/O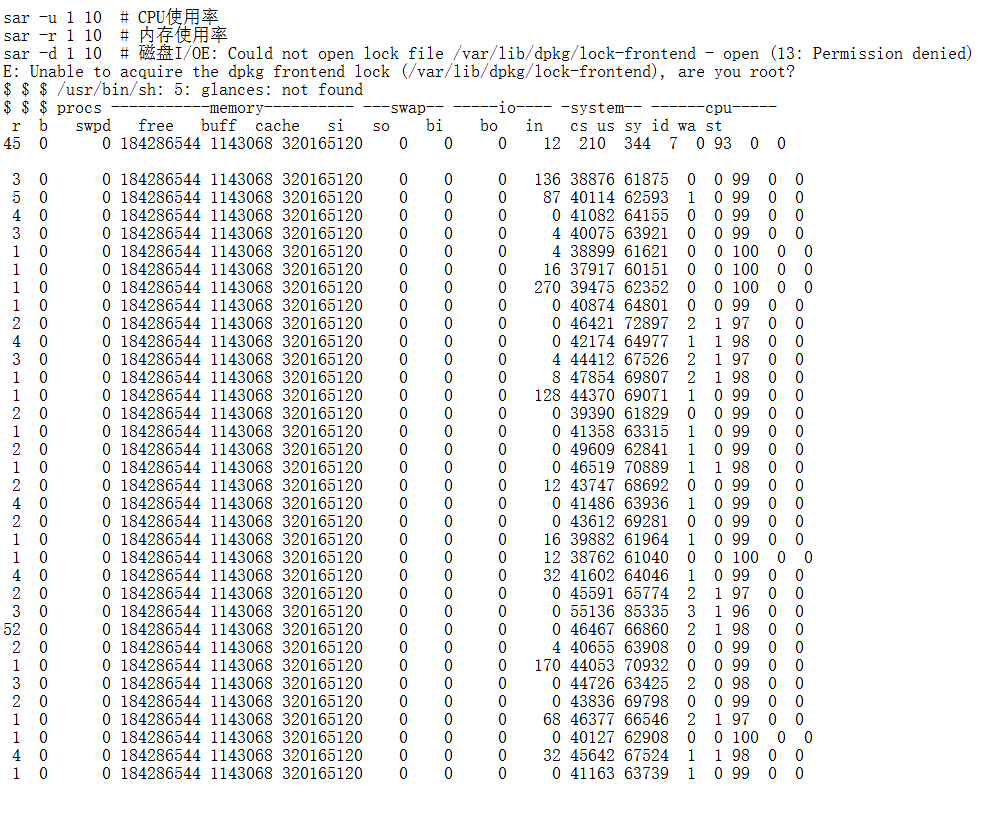
这些工具能够帮助你监控到各个硬件资源的使用情况,及时发现潜在的性能瓶颈。
5.2 GPU 监控脚本
编写自定义 GPU 监控脚本,实时跟踪 GPU 的使用情况:
#!/bin/bash

nvidia-smi dmon -i 0 -s pucvmet -d 1

nvidia-smi --query-gpu=timestamp,name,driver_version,temperature.gpu,utilization.gpu,utilization.memory,memory.total,memory.free,memory.used --format=csv -l 1

nvidia-smi pmon -i 0 -s m
6. 使用 PyTorch Profiler 进行模型性能分析
PyTorch Profiler 是一个强大的工具,能够帮助你深入分析模型的性能瓶颈。通过该工具,你可以获得有关模型推理过程中的详细 CPU、GPU 利用情况、内存占用、每个操作的执行时间等信息。
6.1 基础性能分析
import torch
import torch.profiler
from torch.profiler import profile, record_function, ProfilerActivity

def model_profiling(model, input_data):
    with profile(
        activities=[ProfilerActivity.CPU, ProfilerActivity.CUDA],
        record_shapes=True,
        with_stack=True,
        with_flops=True
    ) as prof:
        with record_function("model_inference"):
            output = model(input_data)

    # 打印性能报告
    print(prof.key_averages().table(sort_by="cuda_time_total", row_limit=10))

    # 导出 Chrome 跟踪文件
    prof.export_chrome_trace("trace.json")

    return output
6.2 详细性能分析
import torch
import torch.nn as nn
from torch.profiler import profile, ProfilerActivity

class DetailedProfiler:
    def __init__(self, model):
        self.model = model

    def profile_inference(self, input_data, warmup_steps=10, profile_steps=100):
        # 预热
        for _ in range(warmup_steps):
            with torch.no_grad():
                _ = self.model(input_data)

        # 性能分析
        with profile(
            activities=[ProfilerActivity.CPU, ProfilerActivity.CUDA],
            record_shapes=True,
            with_stack=True,
            with_flops=True,
            with_modules=True
        ) as prof:
            for _ in range(profile_steps):
                with torch.no_grad():
                    _ = self.model(input_data)

        return prof

    def analyze_results(self, prof):
        # 按 CUDA 时间排序
        print("=== 按 CUDA 时间排序 ===")
        print(prof.key_averages().table(sort_by="cuda_time_total", row_limit=20))

        # 按 CPU 时间排序
        print("\n=== 按 CPU 时间排序 ===")
        print(prof.key_averages().table(sort_by="cpu_time_total", row_limit=20))

        # 按内存使用排序
        print("\n=== 按内存使用排序 ===")
        print(prof.key_averages().table(sort_by="cuda_memory_usage", row_limit=20))

        # 导出详细报告
        prof.export_chrome_trace("detailed_trace.json")

        # 按模块分组分析
        print("\n=== 按模块分组 ===")
        print(prof.key_averages(group_by_stack_n=1).table(sort_by="cuda_time_total", row_limit=20))
6.3 内存分析
import torch
import torch.profiler

def memory_profiling(model, input_data):
    # 启用内存分析
    torch.cuda.memory._record_memory_history(True)

    with torch.profiler.profile(
        activities=[torch.profiler.ProfilerActivity.CPU, torch.profiler.ProfilerActivity.CUDA],
        with_stack=True,
        profile_memory=True,
        record_shapes=True
    ) as prof:
        output = model(input_data)

    # 保存内存快照
    torch.cuda.memory._dump_snapshot("memory_snapshot.pickle")

    # 分析内存使用
    print("=== 内存使用分析 ===")
    print(prof.key_averages().table(sort_by="cuda_memory_usage", row_limit=10))

    return output
通过这些分析,您可以深入了解模型在推理过程中每个操作的资源消耗,并进行针对性优化。